Search
Search

PRIME
One would be forgiven for assuming that a combination of Londoners heading for the country and far fewer overseas buyers reaching our shores in 2020 would have had a serious impact on both activity and prices in prime London last year. Yet the sales market has been resilient, with the number of homes put under offer on a par with 2019 and sales volumes just shy of 14% lower. Prices too ended the year up on last year and the total spent on all transactions in 2020 was just 6% lower than in the previous year.
The lettings market had a much busier end to the year in 2020 than many expected, with the number of new lets up 19% in the fourth quarter. This is a trend landlords will be hoping continues into 2021, in order to absorb some excess stock and limit further falls in achieved rents and increases in voids experienced in the latter part of 2020.
With tighter restrictions in the first lockdown calling a halt on viewings, our usual seasonal peaks and troughs in activity differed last year. In the final months of 2020, a higher number of sellers listed their homes, meaning we start the year with 51% more stock on the market than at the same point a year ago.
The number of prime London properties reaching the market for sale in 2020 remained in line with the five-year average (2015 to 2019). With new instructions in 2020 3% higher than the average over the previous five years. What was different was the point in the year at which these properties came to the market. We saw a 45% fall in new instructions in Q2 2020, compared with the previous five-year average, followed by a 49% increase in Q3 and a further 39% rise in Q4.
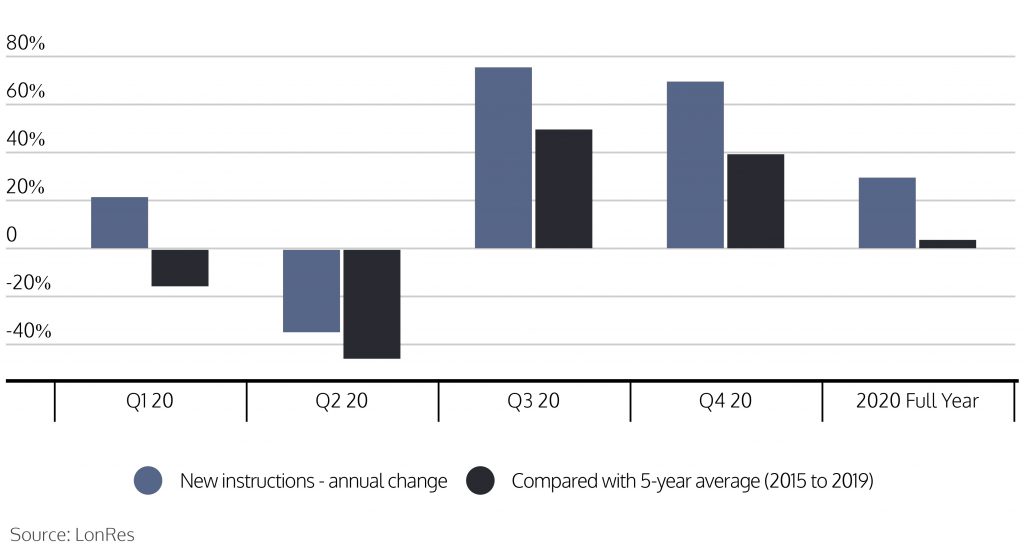
This meant December was far busier than usual, with new instructions double December 2019 levels and 76% higher than the average December between 2015 and 2019.
The effective closure of the UK housing market between March and May impacted on transactions for the remainder of the year too. With fewer properties put under offer in the second quarter of the year it took far longer for the number of transactions to recover to a level close to 2019 volumes.
Yet buyer activity over the year differed little from 2019, with just 1% fewer properties going under offer in 2020 compared with the previous year. In the last three months of 2020 19% more properties went under offer compared with the same period a year earlier. Overall transactions remained 14% lower in 2020 compared with 2019 but in the fourth quarter lagged just 4% behind.
The top end of the market continued to register annual increases in sales. The number of properties sold at £5 million or more increased by 2.3% in 2020 compared with 2019. This growth was driven by large houses, with the number of houses sold at £5 million or more up 13% on 2019.
Despite obvious challenges this year, average prices changed little over the last 12 months. Properties sold in 2020 achieved on average 2.2% more than those sold in 2019. Taking the final quarter in isolation also shows a marginal rise in achieved prices of 0.7%.
Looking ahead we remain optimistic. In the short-term, the property industry has avoided a full lockdown meaning sales can progress and deals continue to be struck.
Later in 2021, much rides on the successful roll out of COVID vaccines, which will hopefully result in an easing of restrictions and allow purchasers to travel more freely. If this is the case, we could see 12 to 18 months of overseas demand return to the market, supporting activity in the second half of 2021.

For the lettings market, high stock levels continue to hamper any expectations on growth in achieved rents. But activity is increasing, with the last three months of 2020 recording higher levels of new lets than 2019, following nine straight months when volumes fell.
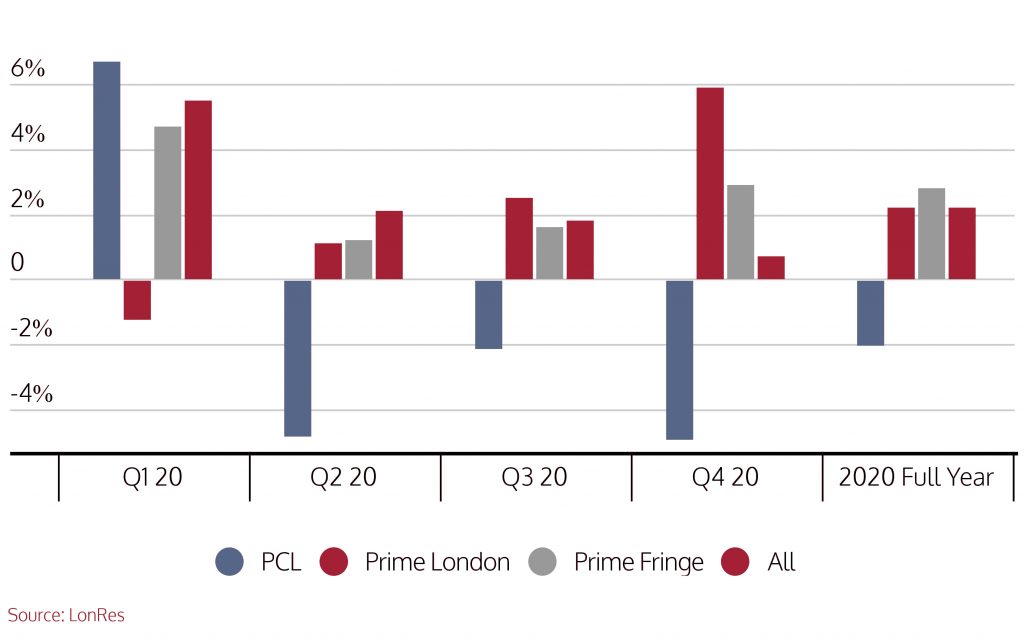
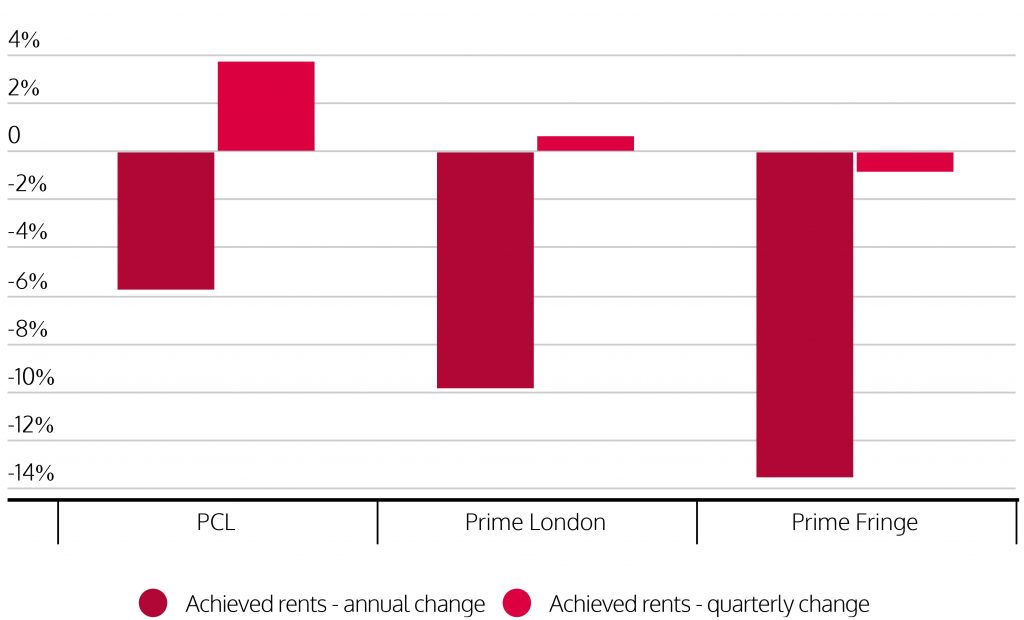
The LonRes Prime London Lettings Index saw annual falls in rents achieved across all three of our prime catchments this quarter. Recording a 5.7% annual fall in prime central London (PCL), a 9.8% fall in prime London and a 13.5% fall in prime fringe in the three months to December compared with the fourth quarter of 2019. But both PCL and prime London saw rents increase compared with Q3, up 3.7%in PCL and 0.6%in prime London, only prime fringe saw rents fall, down a modest 0.8%.
Over the last 12 months, we saw an average of 4% more properties reach the market to let compared with 2019. While annual change in new instructions was modest, and indeed remained 11% lower than the five-year average, fewer new tenants, particularly in the first half of the year, led to stock levels building early on in the first lockdown. An issue which had dogged the rental market for the remainder of 2020 and into 2021.
This means stock levels remain 80% higher at the start of 2021 compared with the same point a year earlier.
It will obviously take a significant shift in demand for the levels of available stock to be absorbed into the market. But there are signs of activity increasing.
There were 19% more new lets agreed in the last three months of 2020 compared with the same period a year earlier. December was particularly busy, with new lets up 38% on a year ago.
With the vaccine rollout in full swing here and indications that they are increasing globally too, we are pinning our hopes for 2021 on our ability to return to some semblance of normality later in the year.
If successful, the lettings market may well be the first to see levels of activity increase as workers and travellers return to the capital. Until then we expect prudent landlords to prioritise good long-term tenants over short-term gains, which we expect could translate into further rental falls in the early part of 2021.
Source: Lonres
*The analysis for this report takes in the three LonRes catchment areas: Prime Central London: SW1Y, SW1X, SW1W, SW1A, SW3, SW7, SW10, W1S, W1K, W1J, W8. Prime London: NW1, NW3, NW8, SW1P, SW1V, W1T, W1H, W1U, W1G, W1W, W2, W11, W14. Prime Fringe: SE1, SE11, SW4, SW5, SW6, SW11, W4, W6, W9, W10.
This issue was produced in January 2021 using data to 31th December 2020
More Articles